On the Application of Passive Source Seismic Frequency Resonance Exploration Technology (SRT)
Summary Report (Bay City, Texas, USA)
Minesound Ltd., Canada
Abstract
In October 2022, KZ Global Energy, a US-based company, conducted an oil and gas exploration experiment in Bay City, Texas, USA. They utilized the seismic frequency resonance exploration technology of Minesound Ltd., Canada. The test area, situated alongside a large salt dome structure, featured complex structures, as well as sandstone and siltstone shale formations. Previous 3D seismic exploration data already existed in the region.
The experimental survey line spanned 600 meters and consisted of 61 measurement points. It ran in a north-northeast direction, intersecting two wells numbered 601 and 602. Well 601 possessed P-wave velocity logging, enabling an approximation of shear wave velocity calibration. The conventional seismic exploration conducted in the north-northwest direction served as a reference section for understanding the geological structure framework of the area.
Minesound Ltd. coordinated personnel and equipment, utilizing a handheld GPS positioning system to determine the measurement points along the experimental section. They collected field data using the company’s seismic frequency resonance data acquisition station and processed it into imaging results. The imaging results were compared to the density logging section of well 601, yielding a favorable agreement. The geological interpretation results also offered suggestions for further layer positioning in well 601 during the perforation process.
1. Geological Overview of the Survey Area
Fig. 1.1 illustrates the SRT section’s location and the geological structure of the survey area. The survey lines, represented by red arrows, extend in the NNE direction and span 600 meters. Positioned on the northeastern flank of the dome structure, the section intersects two boreholes labeled 601 and 602. Analysis of the well logging data from borehole 601 reveals that the target layer predominantly consists of mudstone, siltstone, and thin sandstone. The region exhibits well-developed structures, primarily influenced by the basal dome-shaped salt diapir and a NNW-trending normal fault. The target layer is situated between depths of 500 and 900 meters.
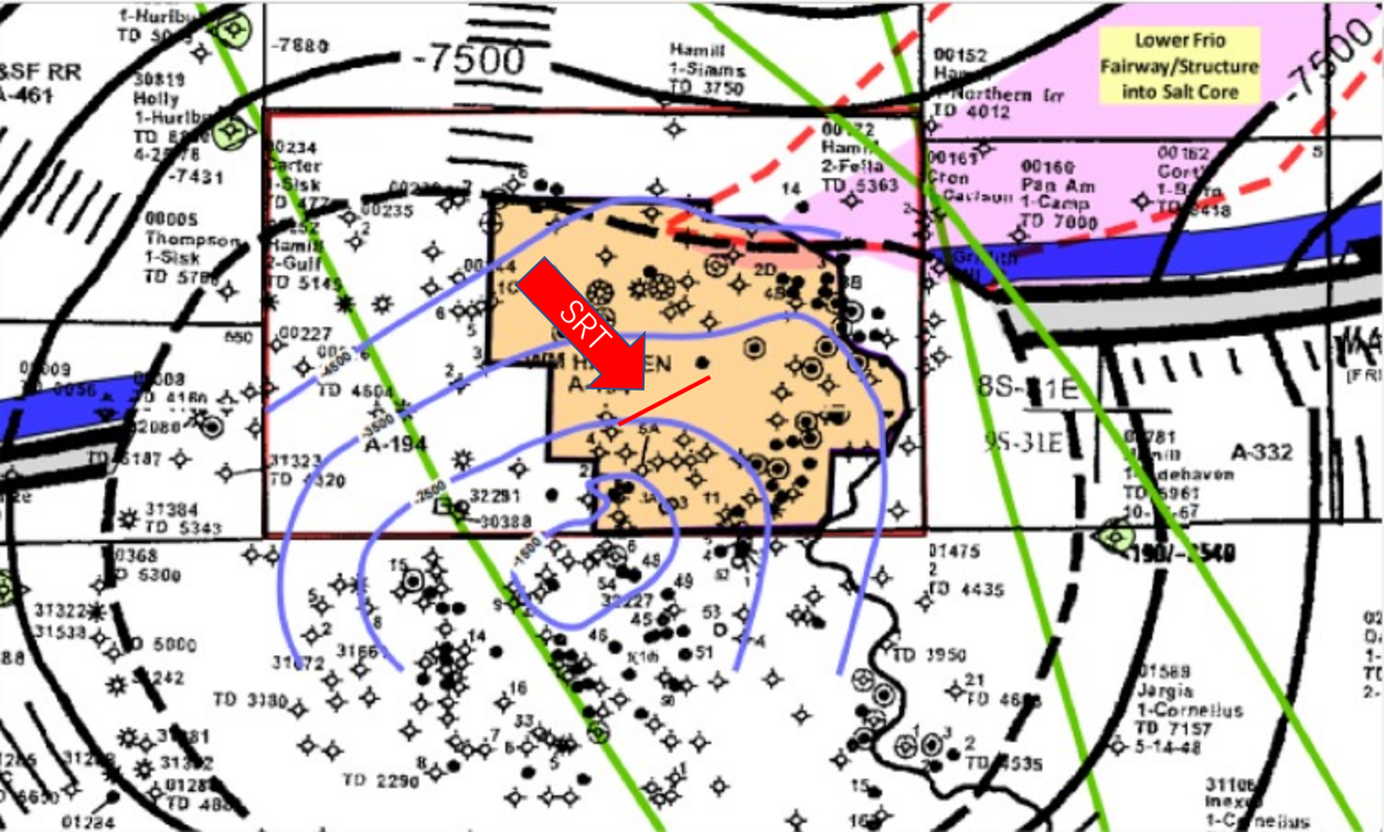
Fig. 1.1 Map Showing Geological Structure and section location
Fig. 1.2 depicts a simplified diagram of the fault system and the location of the SRT section in the area. The dominant orientation of the faults in the region is NNW, and it is possible that one of the larger faults runs between boreholes 601 and 602, intersected by the SRT survey line.
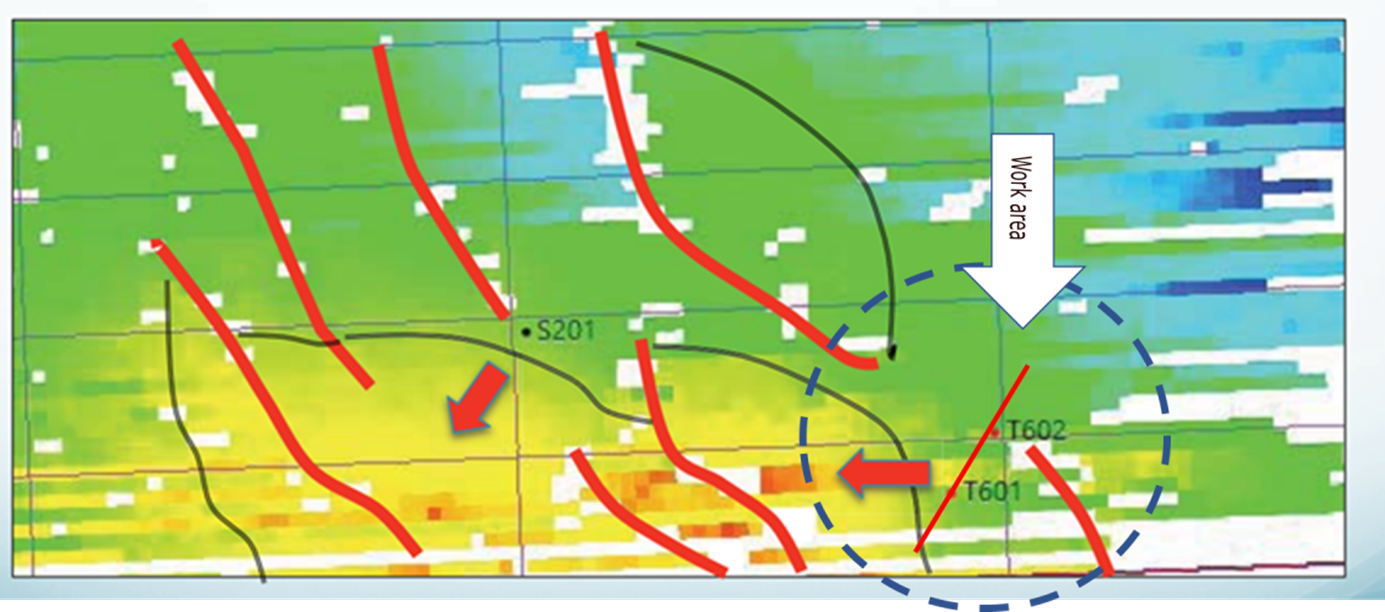
Fig. 1.2 Fault system and SRT section location
2. Exploration Targets and Current Exploration results
In the area, there exists a 3D seismic pre-stack migration section that has been converted to the depth domain. However, due to the limitations of this method, the depiction of faults in conventional reflection seismic sections is not clear, particularly for high-angle faults and zones of fracture development. Additionally, determining information about the geological structure and lithology is challenging. Consequently, although borehole 601 has been drilled, the perforation layer has yet to be determined.
The primary exploration target in the region comprises natural gas reservoirs within sandstone or siltstone layers that possess a certain level of porosity. The estimated depth for these reservoirs ranges from approximately 500 to 900 meters, with the most promising reservoir zone anticipated to be situated between 600 and 800 meters in depth.
The area has undergone 3D reflection seismic exploration. The In-Line direction of the survey line is oriented NNW. Please refer to Fig.s 2.1 and 2.2, which illustrate two seismic sections passing through boreholes 601 and 602.
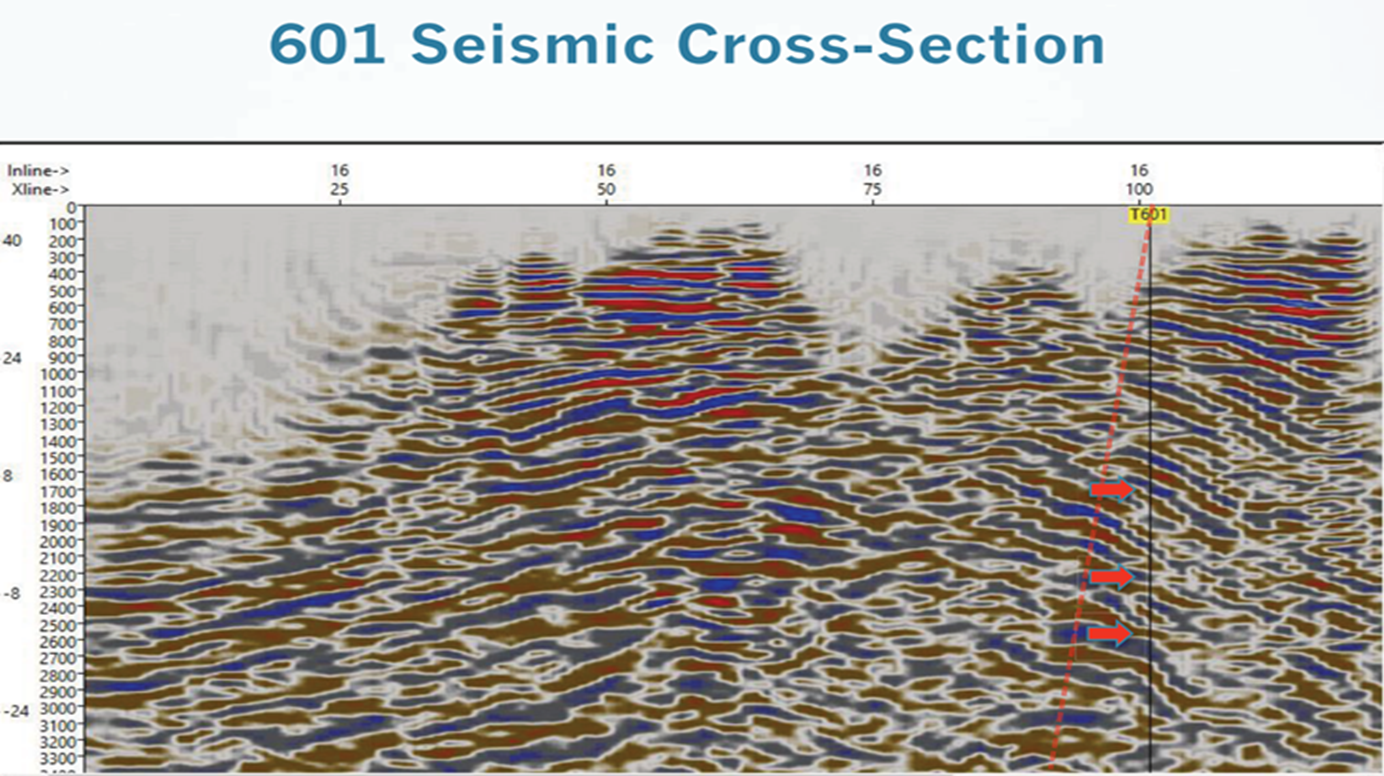
Fig. 2.1 represents the seismic section (A section) that traverses borehole 601 (with depth measurements in feet on the ordinate axis).
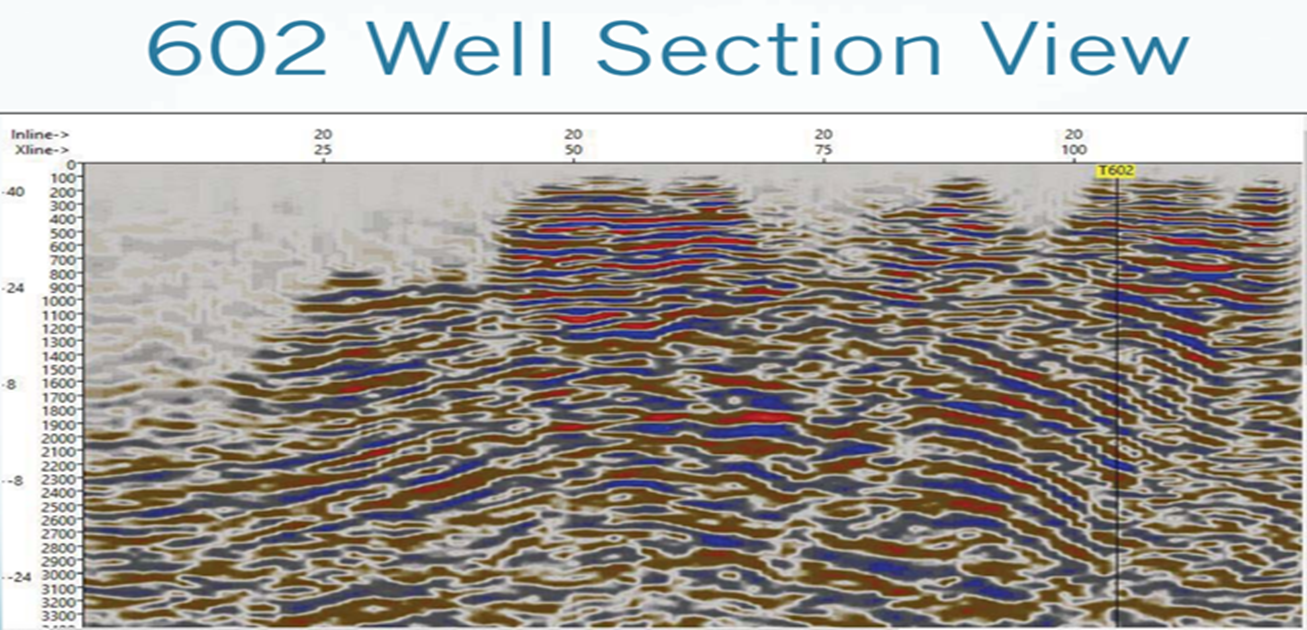
Fig. 2.2 The seismic section (B section) intersecting Well 602 (with depth measurements in feet on the ordinate axis)
Fig. 2.3 illustrates the relationship between the two seismic lines and the SRT section, indicating a diagonal intersection relationship between them.
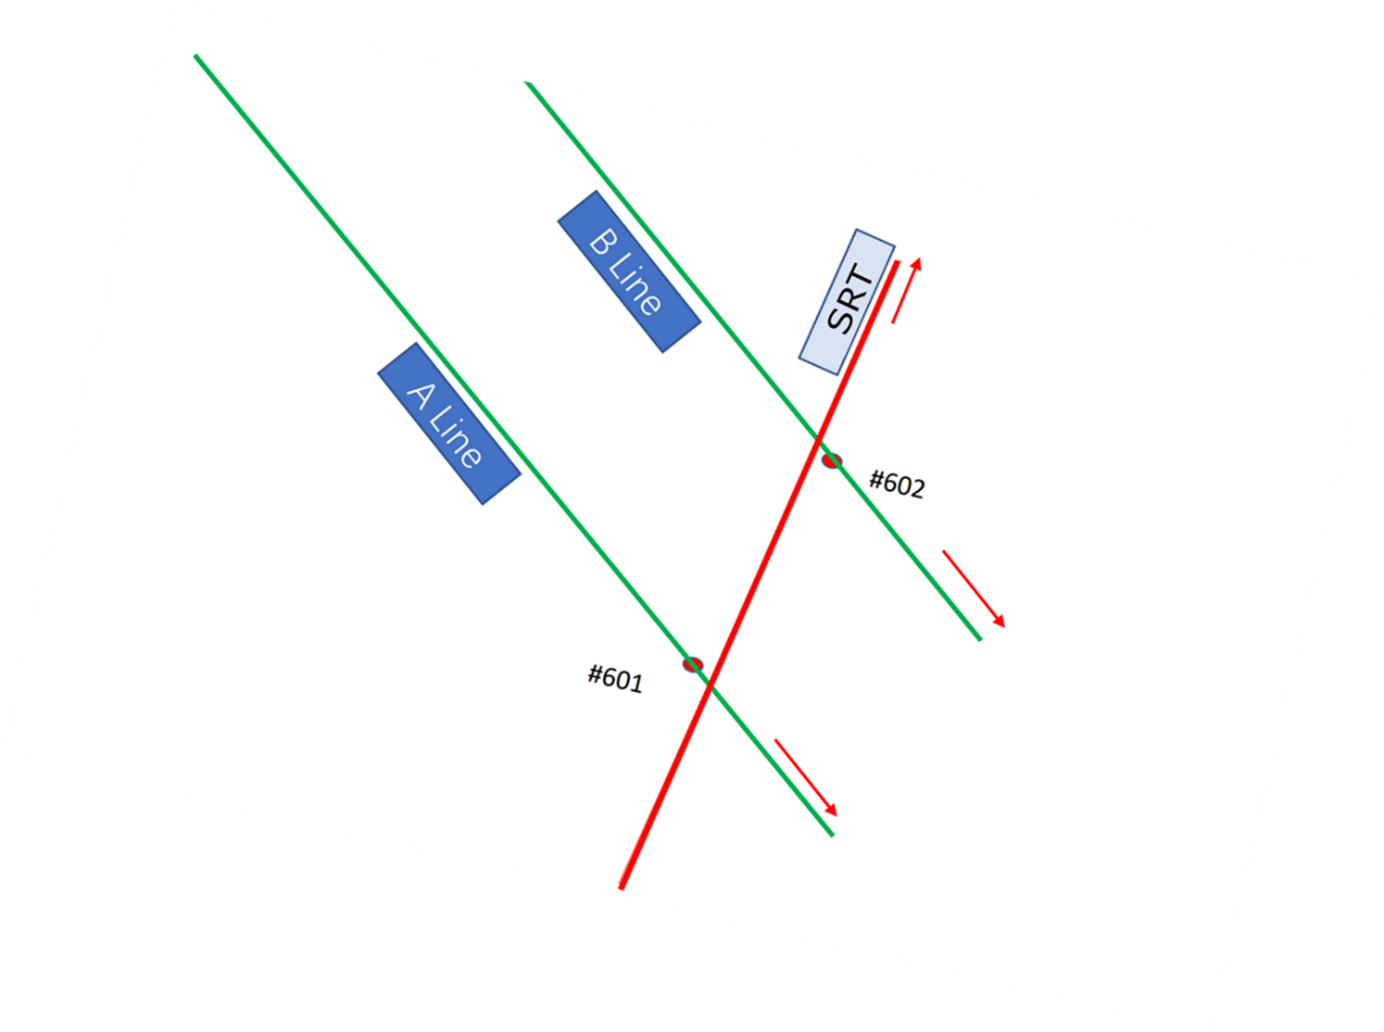
Fig. 2.3 The relationship between the two seismic lines, the SRT survey line, and the two boreholes
The depicted figure demonstrates the intersecting relationship between the SRT section and the two seismic lines, making it challenging to directly compare the detailed exploration results of the SRT with those of the seismic lines. Therefore, our assessment is limited to utilizing a conceptual understanding of the fundamental structural characteristics of the area based on the information provided by the two seismic lines.
3. Concise explanation of the methodology and technical principles used
The Passive Source Frequency Resonance technology (SRT) is a frequency-domain seismic exploration method. Its key characteristic is the utilization of seismic noise to visualize subsurface geological structures, with imaging parameters encompassing impedance ratio, impedance, density, and more. The primary advantages of this technique are as follows:
-
It enables imaging of underground media using seismic noise, eliminating the need for a seismic source, thereby reducing exploration cost and promoting environmental friendliness.
-
With a minimal requirement for field personnel under comparable conditions, it achieves high exploration efficiency.
-
The exploration results directly reveal high-angle fault zones, fracture zones, karst development zones, and facilitate the determination of rock property parameters.
4. Exploration results and recommendations
In order to enhance the impedance imaging of the noise data, an analysis and processing of the logging data from Well 601 were conducted. Fig. 5.1 presents a section of the original logging data alongside the derived sand-mud ratio section data. Based on the sand-mud ratio data depicted in Fig. 5.1, the lithology section (Fig. 5.2) was approximately classified.
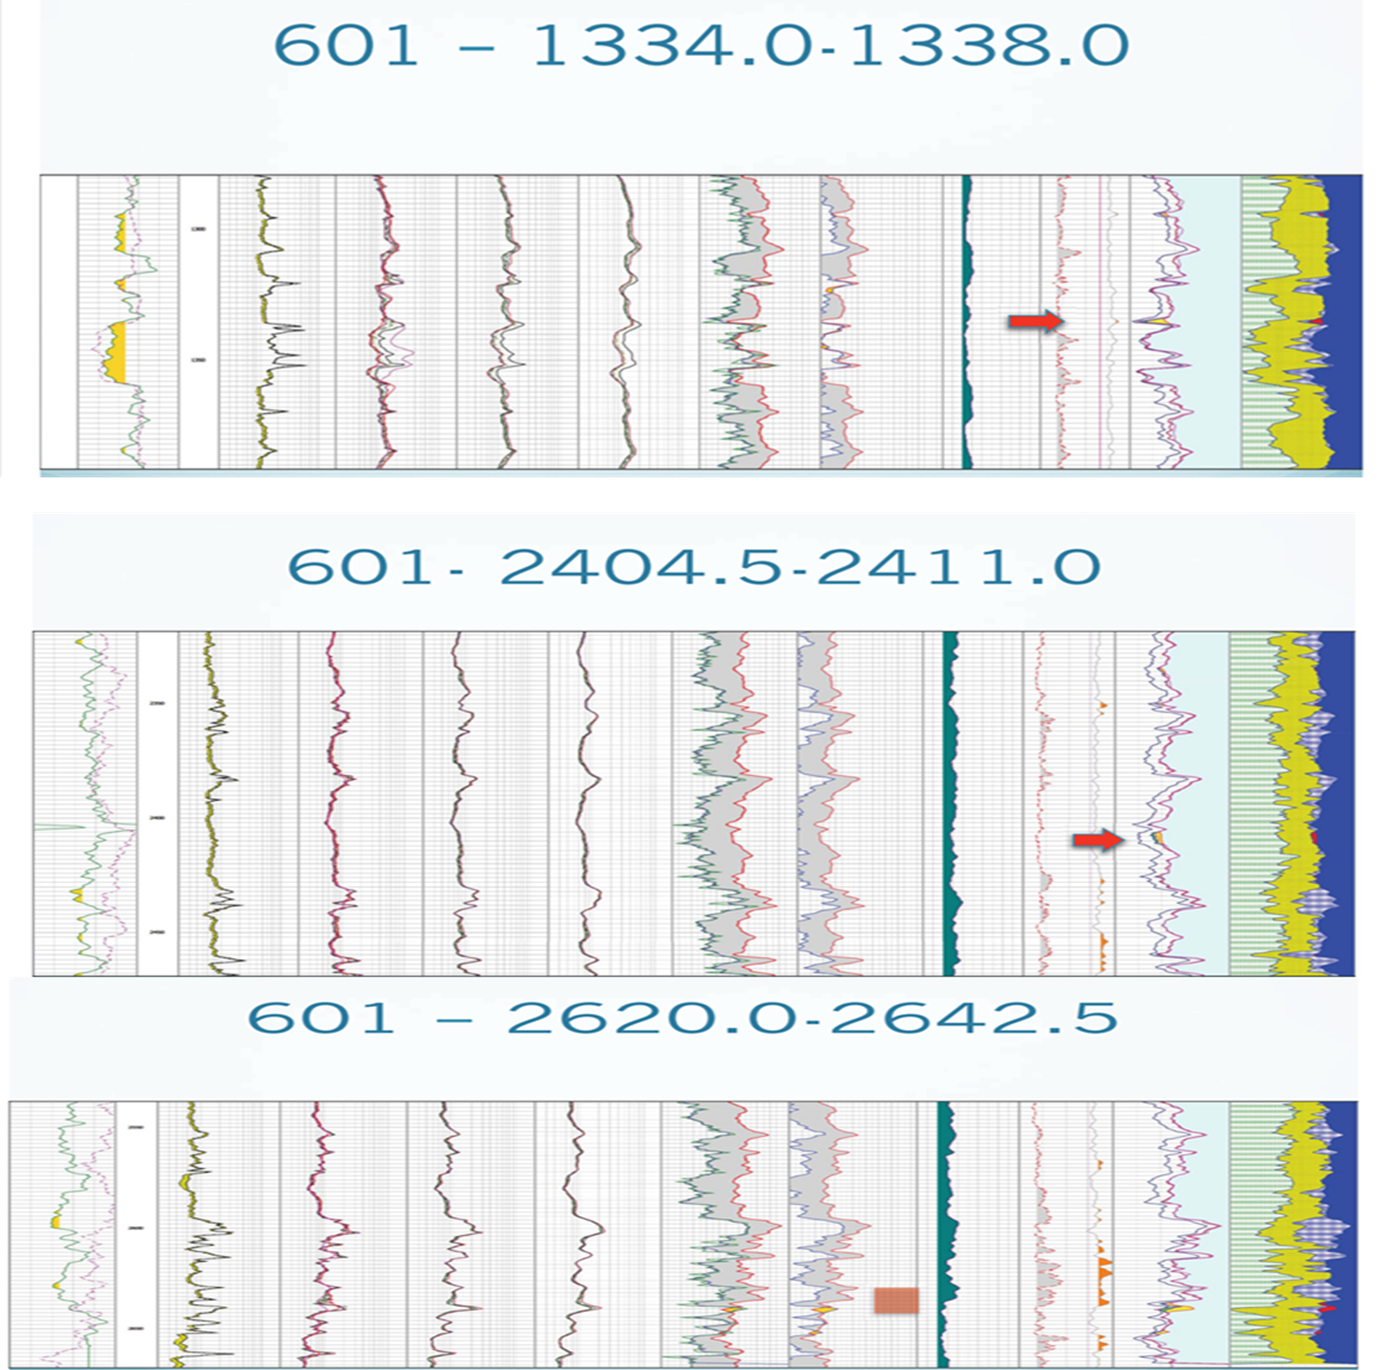
Fig. 5.1 The partial set of original logging data from Well 601, along with the sand-mud ratio section acquired through analysis
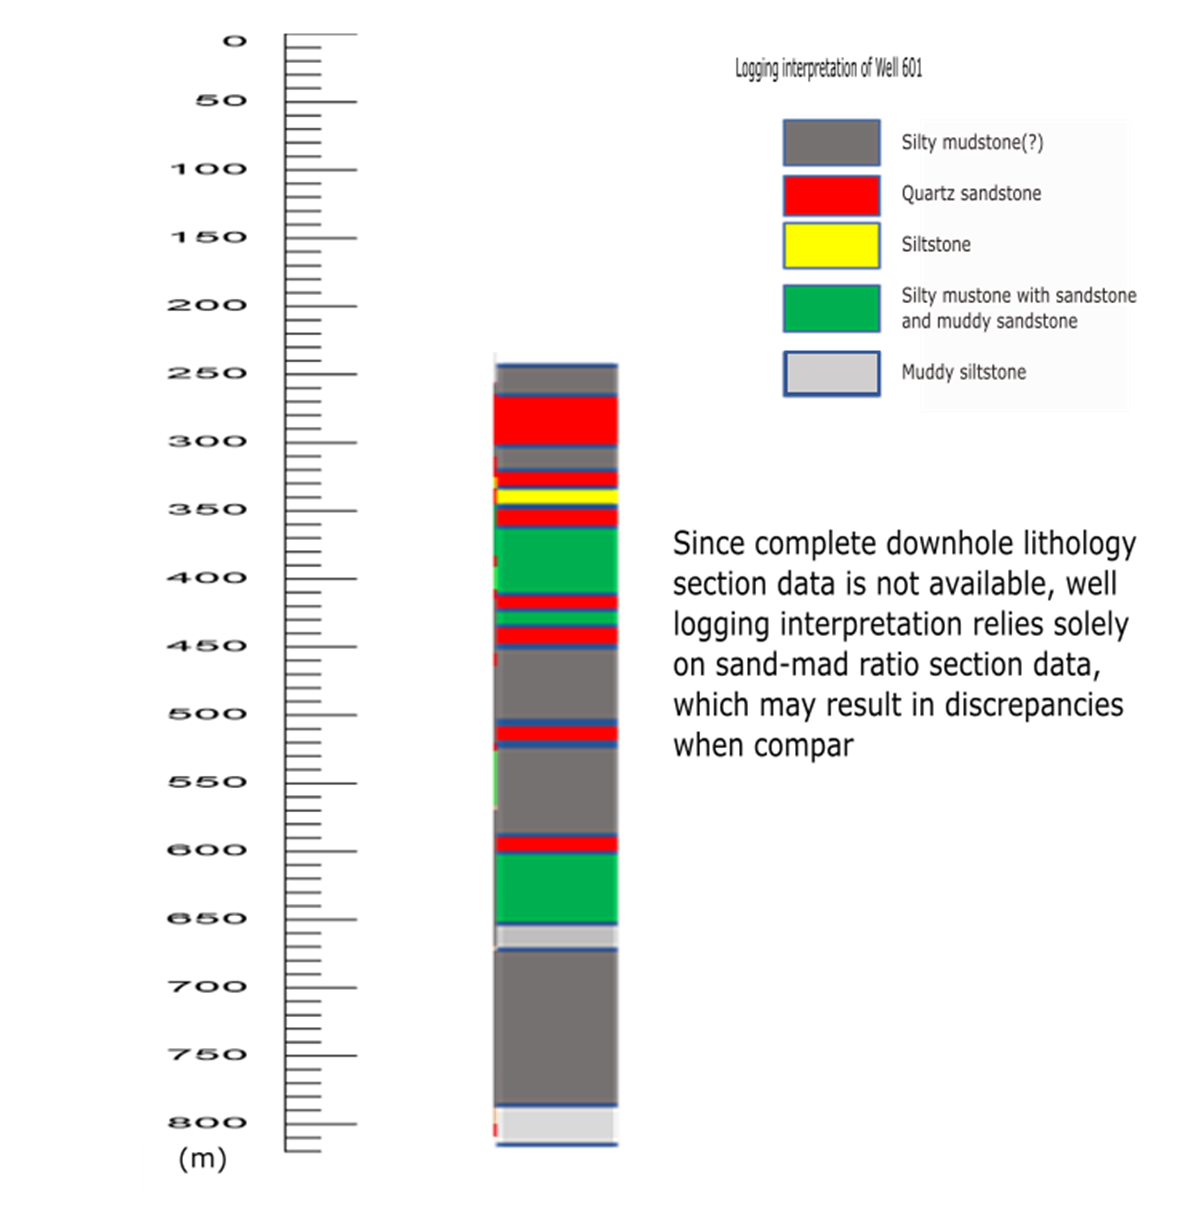
Fig. 5.2 The interpretation of Lithology section of Well 601 based on the sand-mud ratio
The project team gathered density logging data for Well 601. To evaluate the imaging capability of SRT imaging sections for underground rock structures, a 9-point moving average was applied to the data due to significant fluctuations. Fig. 5.3 presents the smoothed density logging data.
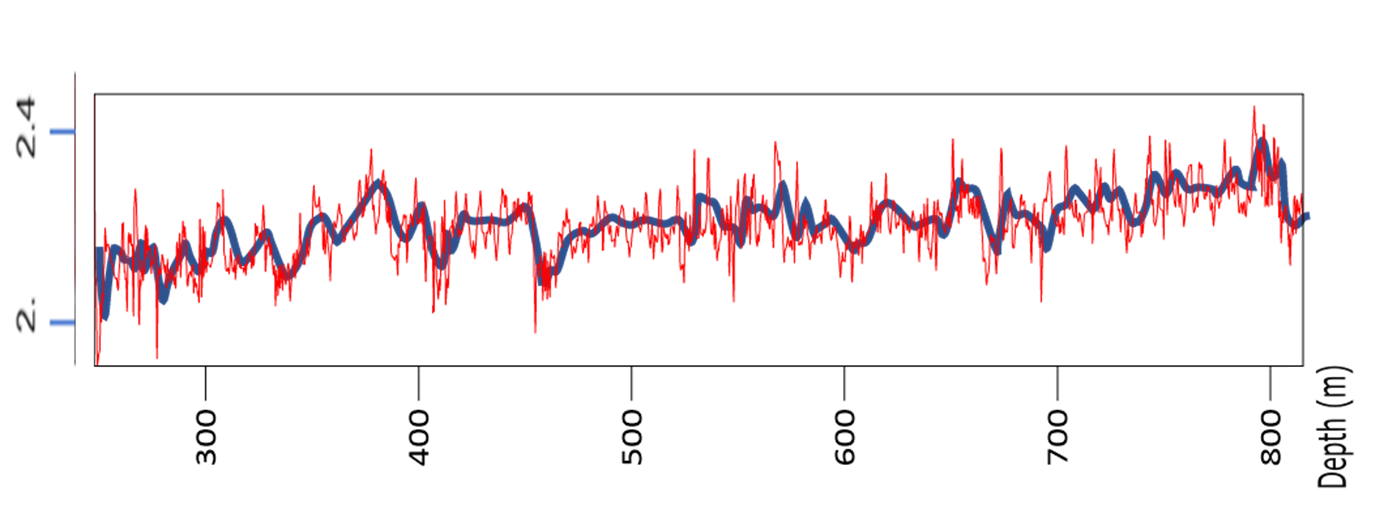
Fig. 5.3 Density logging data curve and corresponding smoothed data curve
During the SRT imaging process, transverse wave velocity parameters are necessary. Since no transverse wave velocity data was collected near this section, the longitudinal wave velocity logging data from Well 601 was multiplied by 0.5 to serve as the required transverse wave velocity parameter for the SRT section imaging. The imaging processing was conducted with an approximation, and there may be a certain depth error compared to the actual geological conditions; however, the depth error is expected to be within 8%. Fig. 5.4 depicts the SRT imaging section aligned with the interpreted lithology section results from the logging of Well 601. The color-coded data in the figure represents the visual impedance [kg/(s•m²/1000)].
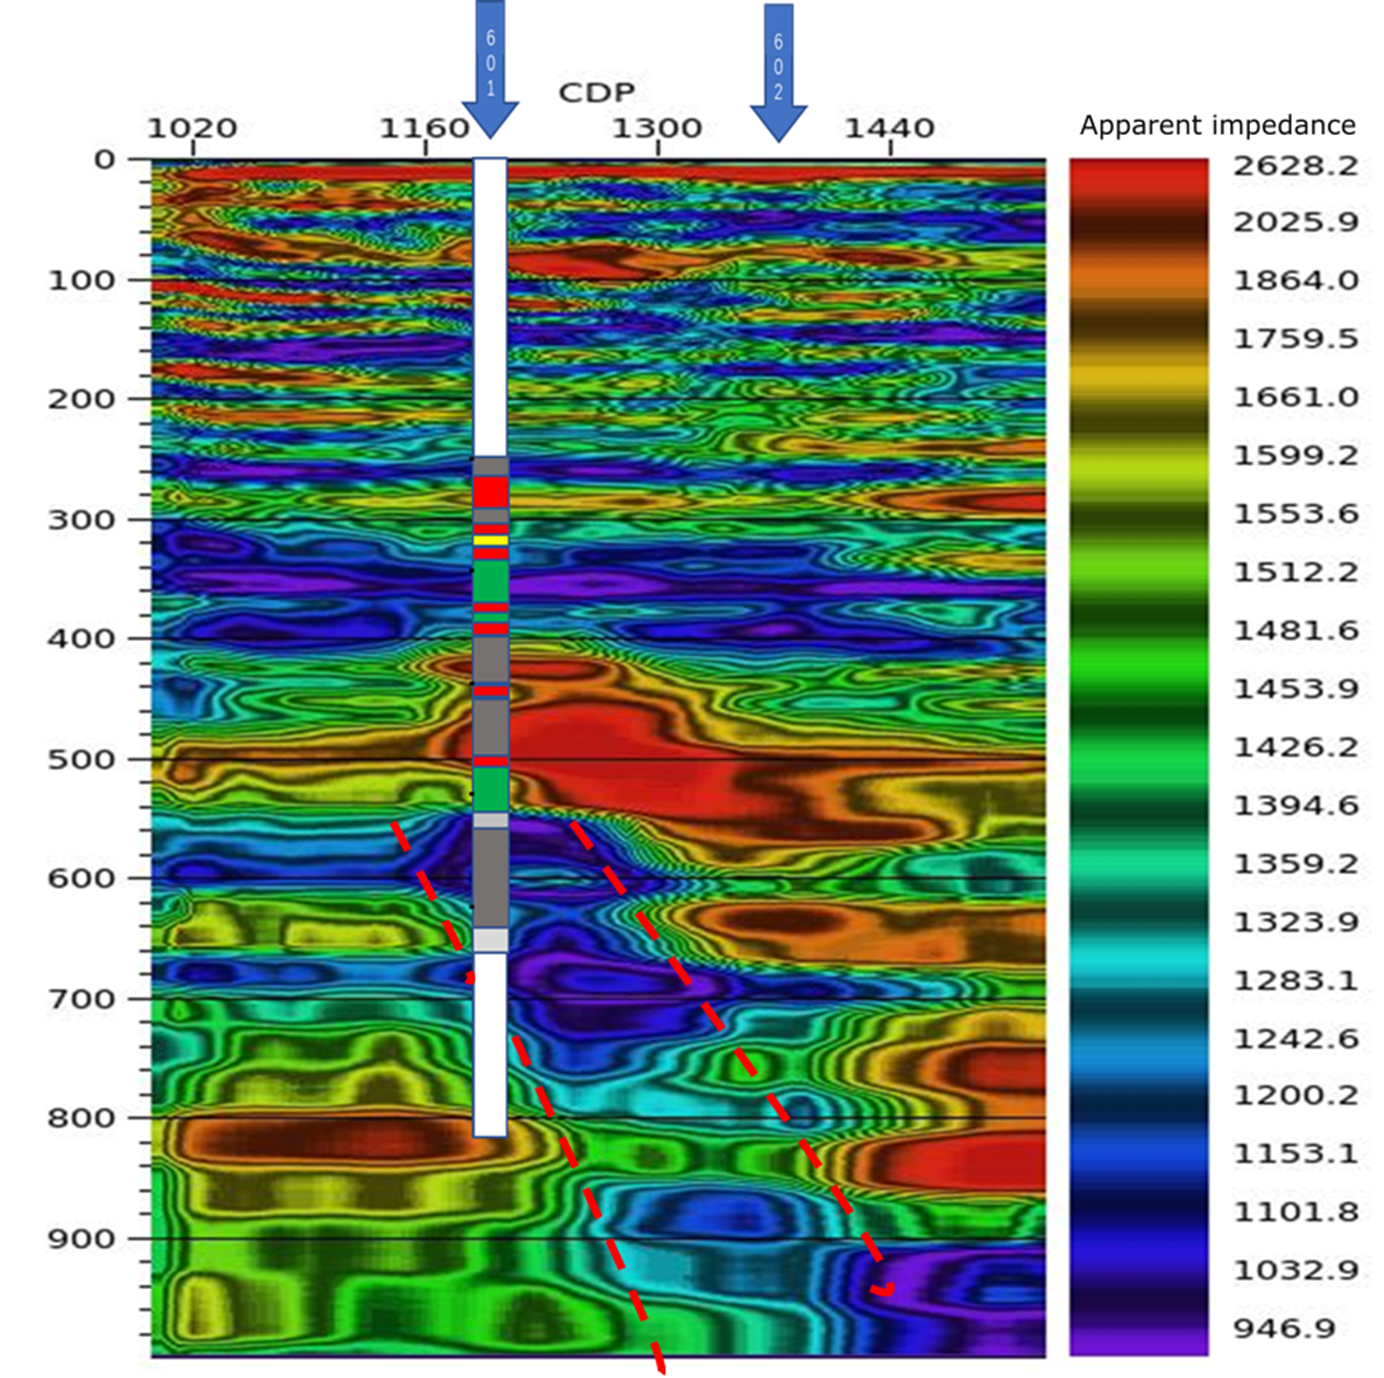
Fig. 5.4 Comparison between SRT imaging section and lithology interpretation results of Well 601
The red markings in the above figure represent lithology with high impedance, while the blue-purple markings indicate lithology with low impedance. As the section length is only 600 meters, the strata appear visually gentle, with a slope of no more than 10 degrees towards the larger point direction (NNE direction). The deeper layers exhibit a higher inclination angle compared to the shallower layers. Below a depth of 400 meters, the structure is well-developed, and there is a steep fault beneath the 601 well at around 500 meters with a width of approximately 150-200 meters. The fault trends in the NNE direction and has an inclination angle of around 45 degrees. Within the fault zone, the rock’s impedance significantly decreases, indicating a higher degree of fracturing or presence of fractures. Notably, two layers of low impedance rock can be observed at depths of 600 meters and 690 meters in the 601 well.
Fig. 5.5 displays the SRT imaging section aligned with the density logging results of Well 601. The color-coded data is consistent with Fig. 5.4.
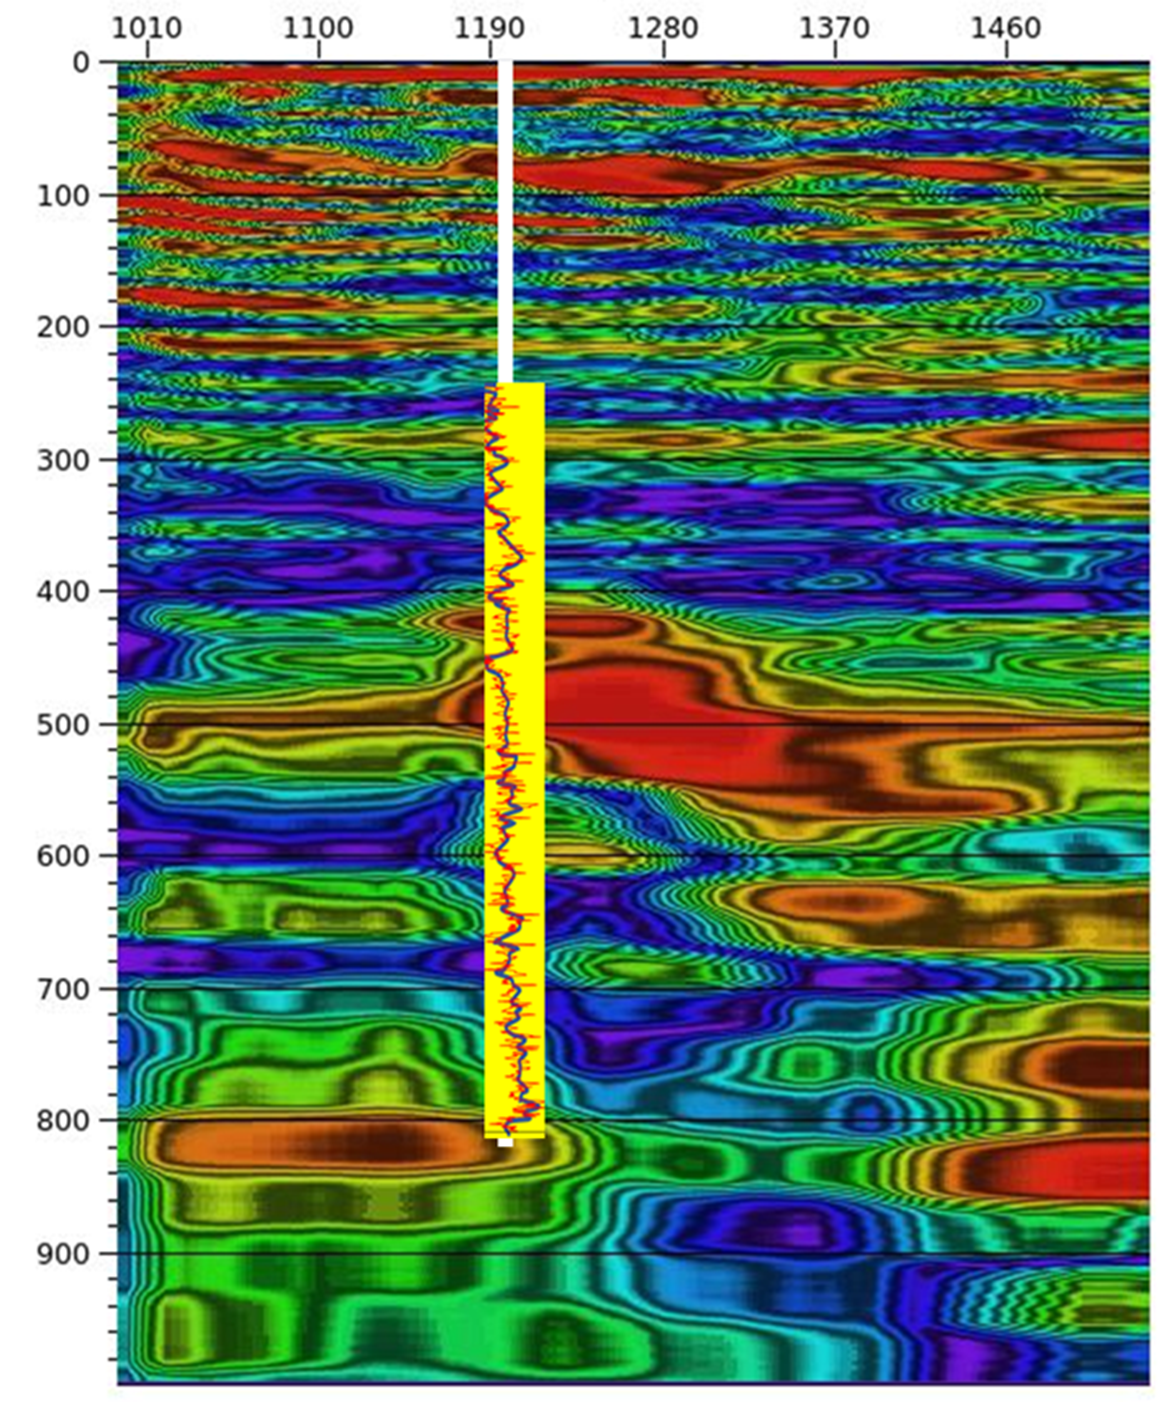
Fig. 5.5 SRT impedance imaging section and Well 601 density logging section
In Fig. 5.5, the density logging curve aligns well with the visual impedance. Beyond a depth of 540 meters, the density curve exhibits significant fluctuations, indicating a sharp change in density, which is a primary characteristic of density parameter variation in the fault zone. The SRT visual impedance image indicates that this depth corresponds to the nearby fault zone’s position. While it is possible that Well 601 did not penetrate the interior of the fault zone, it has been influenced by the fault zone to some extent.
The project team presented the SRT impedance data using a rainbow map and convolution display, both of which have advantages in highlighting structural features, particularly fault-related features.
In Fig. 5.6 (left), the location of the fault break point can be clearly identified. Fig. 5.7 (right) depicts the abrupt layer changes in the rock. Combining Fig. 5.4 to 5.6 with local geological conditions allows for detailed geological interpretation.
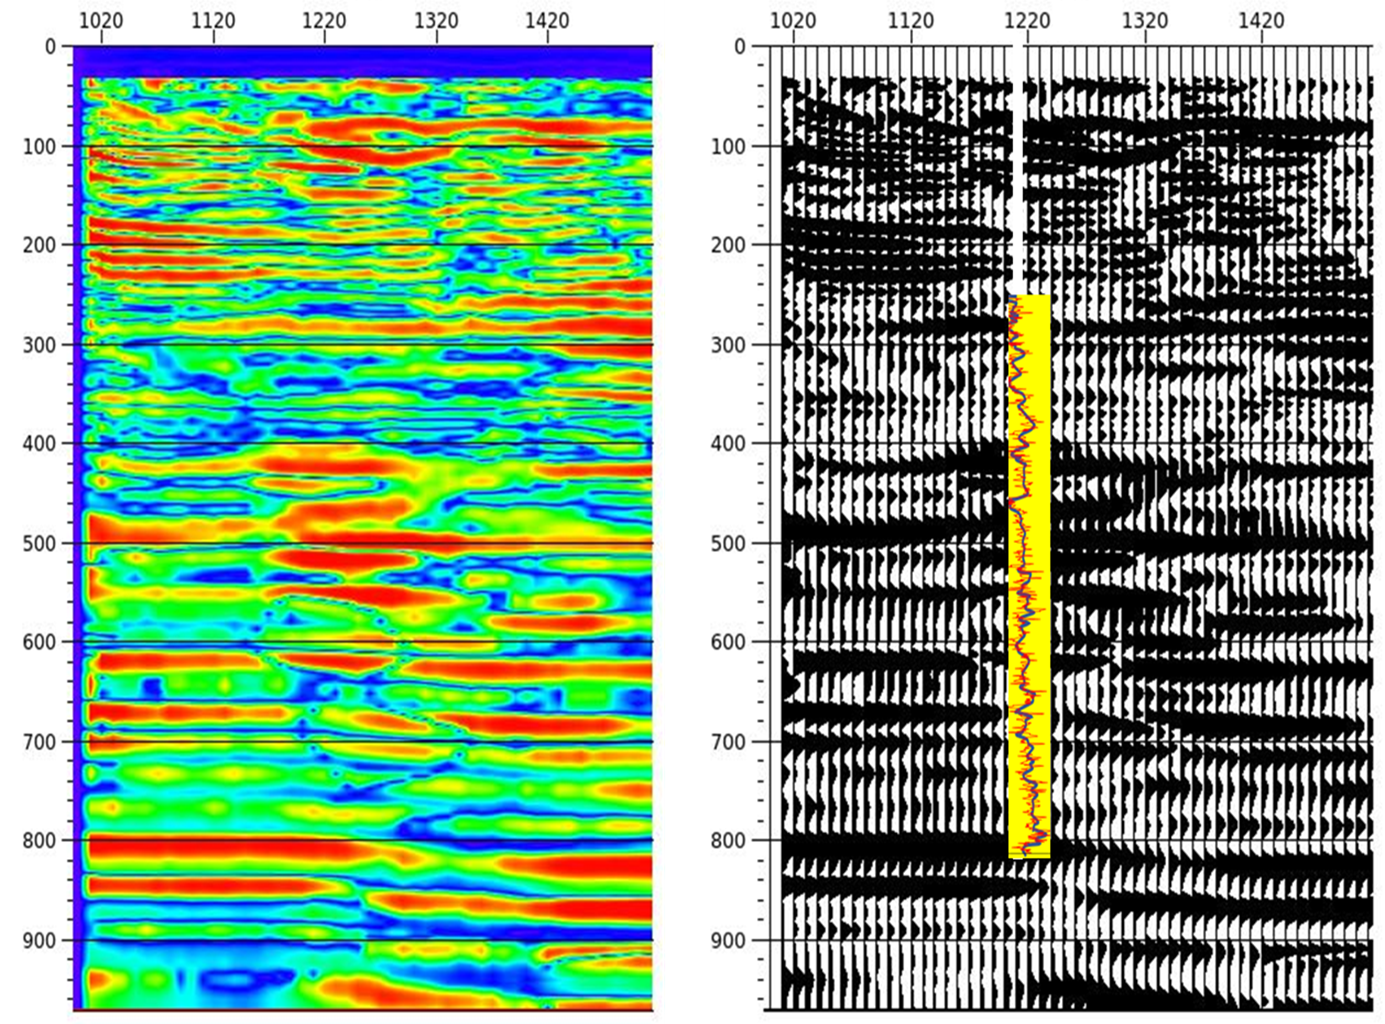
Fig. 5.6 Alternative representations of the SRT impedance section (Left: Rainbow map display; Right: Convolution display of the data)
We have observed that the fundamental structural features of the SRT section differ from those of conventional 3D seismic exploration sections. Although the survey directions are not precisely aligned, their characteristics should be similar due to the area’s basement salt bottom split dome structure. The seismic section’s reflection same-phase axis (Fig. 2.1 to Fig. 2.2) exhibits a cross phenomenon, where the inclined same-phase axis of the fault downthrown block intersects and mixes with the nearly horizontal same-phase axis. This occurrence is typically regarded as an illusion caused by the incomplete offset of the diffraction wave in the fault zone during the seismic data processing. In seismic data processing, the horizontal same-phase axis diagram remains stationary throughout the offset process, while the inclined diffraction wave retracts towards the fault zone during the return processing, separating the two wave sets instead of merging them. Consequently, the inclination angle of the strata in the direction of the larger point in Fig. 2.2 to Fig. 2.3 should not be as significant as portrayed in the seismic section and should not exceed 10-15 degrees. To address this, we have extracted a seismic section of the same length and presented it in Fig. 5.7, which highlights the issue with the seismic section and indicates that the strata’s inclination angle in this area is not substantial when observing the dome structure within such a short section.
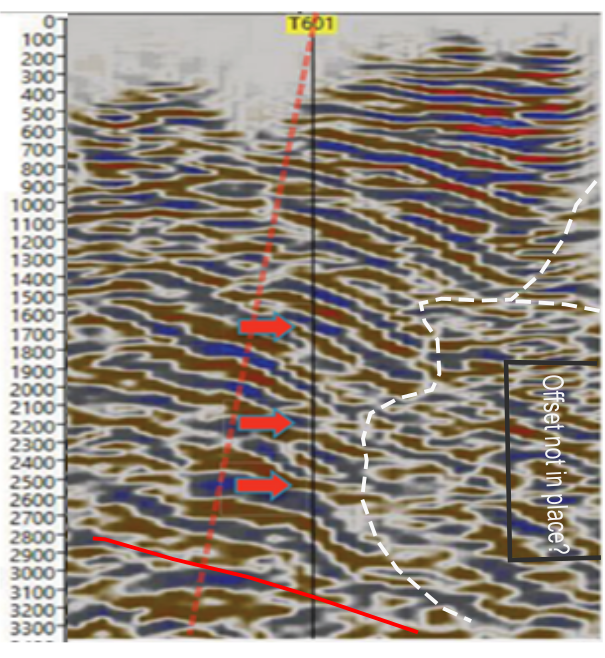
Fig. 5.7 NNW direction of the layer and structure near Well 601 displayed in the seismic section
Based on the successful SRT impedance section and its correspondence with the density logging curve, we recommend the following perforation strategies for Well 601:
(1) Perforation at a depth of 690-700 meters:
-
This interval exhibits low impedance and low-density values, suggesting the presence of a certain thickness of mudstone or siltstone lithology.
-
These lithologies may have a certain porosity, and combined with fractures near the fault zone, they could potentially provide gas storage conditions.
(2) Perforation at a depth of 730 meters:
-
In this interval, density decreases as the well enters the fault zone.
-
The significant reduction in impedance and low-density values indicate the possibility of mudstone or siltstone lithology with certain porosity and permeability, which may offer gas storage potential.
Additionally, perforation considerations for Well 601 include:
- Perforation at a depth of 600-610 meters: This section is characterized by low impedance values. If it is a silty rock type, it is likely to have a certain porosity. However, if it is a mudstone type, the porosity may not necessarily be high, given the lower density of mudstone.
For Well 602, we propose the following recommendations.
(1) The formation position of Well 601 is similar to that of Well 602, with a slight increase in depth of approximately 10 meters. Therefore, it is suggested to perforate the formation at a similar depth in Well 602, considering it may consist of sandy mudstone with a certain porosity.
(2) As no drilling data is available for Well 602, there may be deviations in depth, typically within 5-10 meters. Considering that both wells are located on opposite sides of the fault, and assuming the formation depth increases at the location of Well 602, it is reasonable to adjust the perforation position of Well 602 by approximately 10 meters deeper.